Survival Analysis for Customer Churn
A blog-style report of the survival analysis workflow and results for the midterm project of STA323 (Big Data Analysis Software and Application).
Introduction
This post presents the survival analysis report for the midterm project of STA323 (Big Data Analysis Software and Application) on customer churn. Following the general workflow of the Databricks tutorial, I reproduced the case on the Telco Customer Churn dataset and completed the full process from data preparation to model fitting and result interpretation.
The analysis combines PySpark for data loading and cleaning with lifelines for survival modeling. The main objective is not only to describe how customer retention declines over time, but also to identify which variables are associated with lower churn risk, longer retention time, and higher long-term value.
Data Preparation
The project started with reading the Telco Customer Churn CSV file into Spark and defining an explicit schema to keep the variable types consistent. This was important because later steps required both clean numerical fields and well-structured categorical variables for one-hot encoding.
I also cleaned the totalCharges field by converting blank strings to missing values and then casting the column to double. After that, I built two layers of data:
bronze_telco_df: the raw Spark dataset after basic ingestionsilver_telco_df: the analysis-ready dataset after cleaning and filtering
The bronze layer contained 7,043 customers. The silver layer contained 3,351 customers after restricting the sample to month-to-month contracts and removing customers without internet service. I also converted the original churn label into a binary event variable, where 1 means churn occurred and 0 means the customer remained active during the observation window.
Kaplan-Meier Analysis
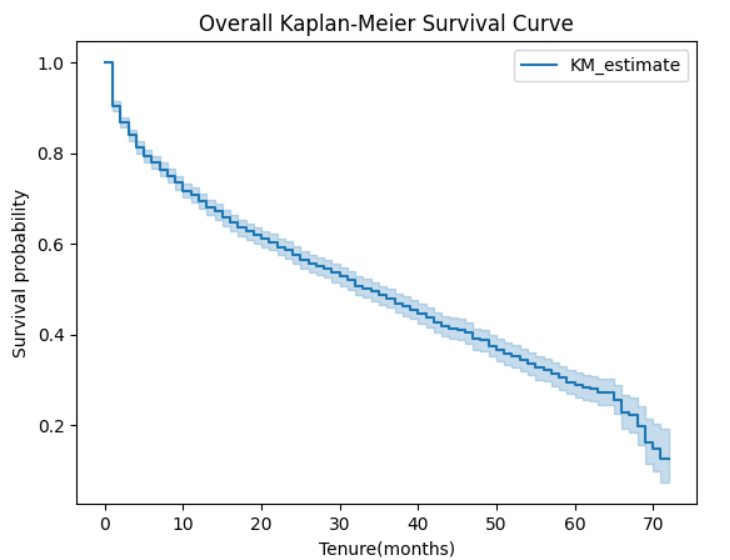
The Kaplan-Meier estimator was first used to describe the overall retention pattern of the filtered customer cohort, where tenure is treated as the duration variable and churn is the event variable. For the full sample, the estimated median survival time was about 34 months, indicating that roughly half of the customers in the filtered cohort were expected to churn by around month 34. The overall survival curve declines steadily over time, suggesting that churn risk accumulates gradually rather than occurring at a single time point.
To examine whether different customer groups followed different retention trajectories, I compared Kaplan-Meier curves across multiple variables and used log-rank tests to evaluate statistical significance. The results show that gender, seniorCitizen, and phoneService did not produce significant differences in survival time, while household-related variables such as partner and dependents, as well as several service-related variables including internetService, onlineSecurity, onlineBackup, deviceProtection, techSupport, and paperlessBilling, showed clear group differences. This pattern suggests that basic demographic attributes alone are not enough to strongly differentiate churn timing, whereas service usage and household structure are more closely associated with customer retention.
| Variable | Test statistic | p-value | Significant |
|---|---|---|---|
| gender | 2.038938 | 0.153317 | No |
| seniorCitizen | 0.125471 | 0.723174 | No |
| partner | 135.758896 | 2.252911e-31 | Yes |
| dependents | 35.031241 | 3.244576e-09 | Yes |
| internetService | 25.172866 | 5.241449e-07 | Yes |
| onlineSecurity | 141.603160 | 1.187554e-32 | Yes |
| onlineBackup | 189.482865 | 4.122979e-43 | Yes |
| deviceProtection | 71.496825 | 2.777047e-17 | Yes |
| techSupport | 90.430334 | 1.916059e-21 | Yes |
| paperlessBilling | 8.340802 | 0.003876 | Yes |
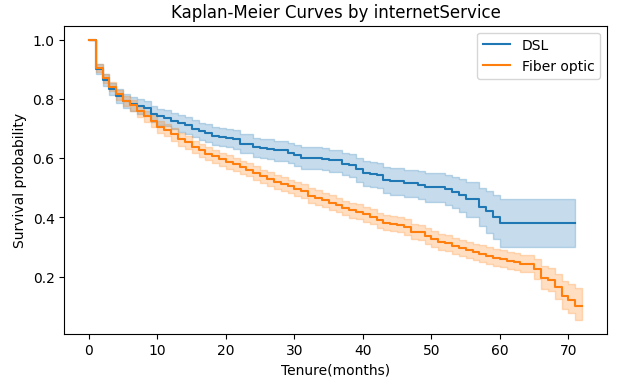
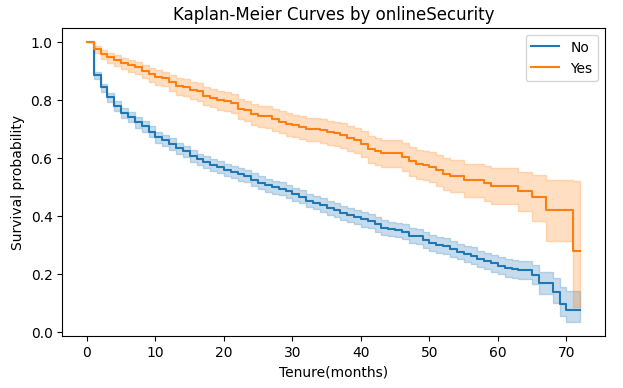
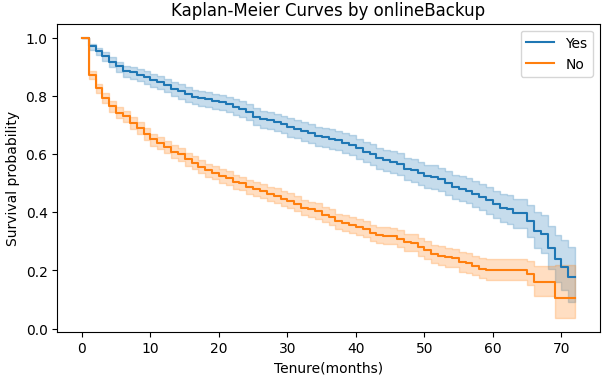
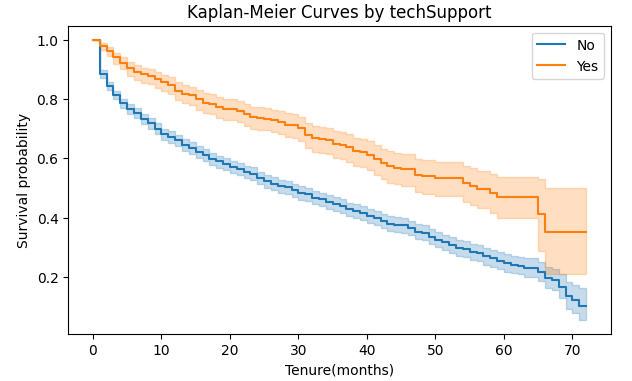
Among the significant variables, service-support features were especially informative. Figure 2 presents four representative grouped Kaplan-Meier survival curves for internetService, onlineSecurity, onlineBackup, and techSupport. The curve for internetService shows a significant difference between DSL and Fiber optic customers, indicating that different service types are associated with distinct retention patterns. The remaining three plots all show clear separation between groups: customers who used onlineSecurity, onlineBackup, or techSupport consistently maintained higher survival probabilities and stayed active longer through most of the contract horizon.
Overall, the Kaplan-Meier analysis suggests that churn timing is not strongly differentiated by some basic demographic variables, such as gender or senior status, but is closely associated with household structure and service-related features. In particular, backup, security, and support services repeatedly show stronger differences in survival patterns, which is consistent with the later Cox and AFT results.
Cox Proportional Hazards Model
To move beyond descriptive survival curves and identify multivariable risk factors, I fitted a Cox proportional hazards model. While the Kaplan-Meier analysis highlighted which customer groups showed different retention trajectories, the Cox model allowed me to evaluate whether those differences remained meaningful after considering multiple covariates simultaneously. The model was constructed after one-hot encoding selected variables, including dependents, internetService, onlineBackup, techSupport, and paperlessBilling.
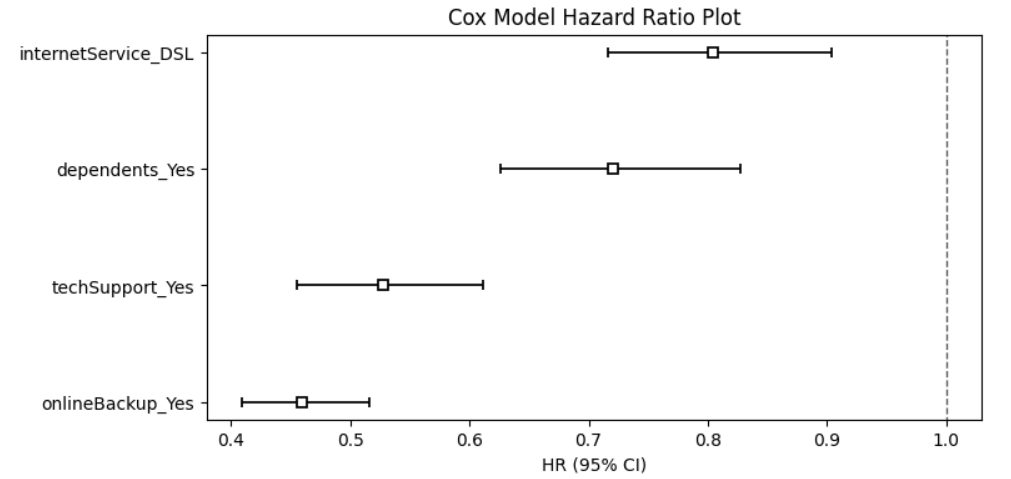
The final results indicate that four variables are especially important in explaining churn risk: dependents_Yes, internetService_DSL, onlineBackup_Yes, and techSupport_Yes. Their hazard ratios are all below 1, indicating that these variables are associated with a lower risk of churn. Among them, onlineBackup_Yes and techSupport_Yes show the strongest protective effects, suggesting that support-related service features are particularly important for customer retention. By comparison, dependents_Yes and internetService_DSL are also linked to lower churn risk, but their effects are more moderate. These findings are also consistent with the earlier Kaplan-Meier analysis, where service-support variables showed especially clear group differences.
| Variable | coef | Hazard ratio | 95% CI lower | 95% CI upper | p-value | Interpretation |
|---|---|---|---|---|---|---|
| dependents_Yes | -0.33 | 0.72 | 0.63 | 0.83 | <0.005 | Customers with dependents show lower churn risk. |
| internetService_DSL | -0.22 | 0.80 | 0.72 | 0.90 | <0.005 | DSL customers show lower churn risk. |
| onlineBackup_Yes | -0.78 | 0.46 | 0.41 | 0.52 | <0.005 | Customers with online backup show substantially lower churn risk. |
| techSupport_Yes | -0.64 | 0.53 | 0.46 | 0.61 | <0.005 | Customers with technical support show substantially lower churn risk. |
At the model level, the Cox fit reported a concordance of 0.64, a partial AIC of 22639.90, and a likelihood ratio test statistic of 337.77 with 4 degrees of freedom. These values suggest that the selected covariates provide meaningful explanatory power, even though the model is better suited for interpretation than for highly accurate prediction.
I also checked the proportional hazards assumption. The results showed that internetService_DSL, onlineBackup_Yes, and techSupport_Yes did not fully pass the assumption check, while dependents_Yes did. This means the corresponding hazard ratios should be interpreted as average effects over time rather than perfectly constant effects at every time point. Therefore, the Cox model remains useful for identifying the main direction and relative importance of key churn-related factors, but its results should be interpreted with appropriate caution.
AFT Model
To complement the Cox model, I also fitted a log-logistic accelerated failure time model. Unlike the Cox model, which focuses on relative hazard, the AFT perspective emphasizes whether certain variables delay churn or accelerate it in the time dimension. This provides a useful additional view of customer retention beyond hazard-based interpretation.
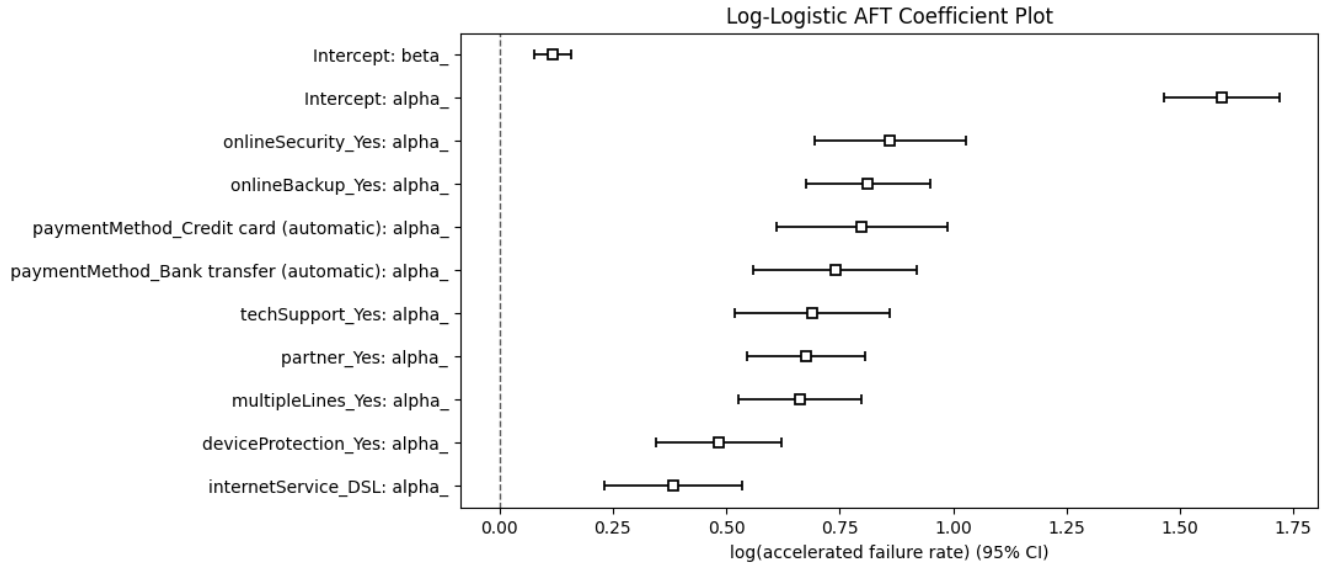
The AFT model included one-hot encoded variables such as partner, multipleLines, internetService, onlineSecurity, onlineBackup, deviceProtection, techSupport, and paymentMethod. Several coefficients were strongly associated with longer retention time, especially onlineSecurity_Yes, onlineBackup_Yes, paymentMethod_Creditcard(automatic), paymentMethod_Banktransfer(automatic), techSupport_Yes, and partner_Yes. Because their exp(coef) values are all above 1, these variables indicate a longer expected time until churn.
More importantly, the main findings are consistent with the Kaplan-Meier and Cox results. Service-support variables such as onlineSecurity, onlineBackup, and techSupport repeatedly appear as important retention-related factors, while stable automatic payment methods and stronger household-related relationships are also associated with longer customer lifetime. This consistency across different models strengthens the overall interpretation of the analysis.
| Variable | coef | exp(coef) | p-value | Interpretation |
|---|---|---|---|---|
| onlineSecurity_Yes | 0.86 | 2.37 | <0.005 | strongly prolongs retention time |
| onlineBackup_Yes | 0.81 | 2.25 | <0.005 | strongly prolongs retention time |
| paymentMethod_Creditcard(automatic) | 0.80 | 2.22 | <0.005 | strongly prolongs retention time |
| paymentMethod_Banktransfer(automatic) | 0.74 | 2.10 | <0.005 | prolongs retention time |
| techSupport_Yes | 0.69 | 1.99 | <0.005 | strongly prolongs retention time |
| partner_Yes | 0.68 | 1.97 | <0.005 | prolongs retention time |
| multipleLines_Yes | 0.66 | 1.94 | <0.005 | prolongs retention time |
| deviceProtection_Yes | 0.48 | 1.62 | <0.005 | moderately prolongs retention time |
| internetService_DSL | 0.38 | 1.47 | <0.005 | moderately prolongs retention time |
At the model level, the AFT model achieved a concordance of 0.73, which is higher than the Cox model’s 0.64 under the current specification. The report also recorded an AIC of 13698.72, a log-likelihood of -6838.36, and 1556 observed events. Overall, the AFT model provided a useful complementary perspective on time-to-churn and showed stronger discriminatory performance in the current setting.
CLV Estimation
After fitting the survival models, I used the estimated survival probabilities to approximate customer lifetime value. This part of the analysis connects statistical retention modeling with a more business-oriented question: how much long-term value can a retained customer generate?
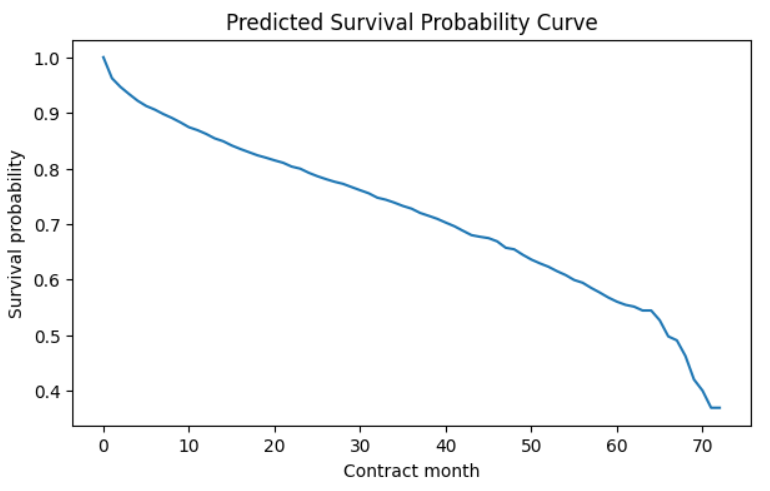
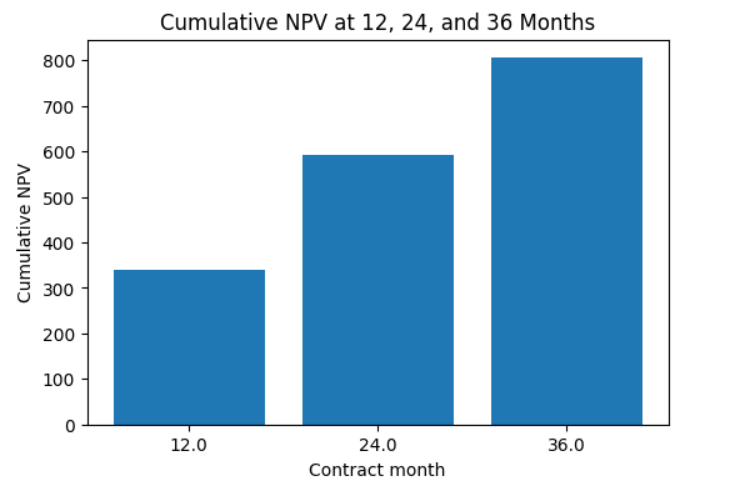
The calculation was based on a sample customer profile. I predicted the future survival probability month by month and combined those probabilities with a monthly profit of 30 and a monthly discount rate of 0.10 / 12. As the predicted survival probability declines over time, the expected profit contributed in each future month also declines. However, this decline is gradual rather than immediate.
The cumulative discounted value still continues to grow over the medium term. For the sample customer, the cumulative net present value was approximately 339.09 at 12 months, 593.35 at 24 months, and 805.24 at 36 months. This suggests that even though churn risk increases over time, customers can still generate substantial discounted value as long as their survival probability remains reasonably high in the earlier periods.
Conclusion
This survival analysis workflow shows how customer churn can be examined from several complementary perspectives. Kaplan-Meier analysis describes the overall retention pattern, the Cox model identifies variables associated with lower or higher churn risk, the AFT model highlights factors that extend customer lifetime, and CLV estimation translates those findings into business value.
Across these methods, the overall conclusions are broadly consistent. Features such as onlineBackup, onlineSecurity, techSupport, automatic payment methods, and stronger household-related relationships are repeatedly associated with lower churn risk and longer retention. This consistency across different models makes the interpretation more convincing.
Overall, this project shows that survival analysis is not only useful for describing when customers are likely to churn, but also for turning retention patterns into interpretable and actionable business insights.